Economies move in cycles – always have, always will
The Federal Reserve has been steadily increasing interest rates in an attempt to slow the rate of inflation. Its efforts are yielding some results, although inflation remains stubbornly high. This may cause the Fed to keep rates higher for longer, which may increase the chances of a recession.
It’s important to remember that economic fluctuations are normal, and if we enter a recession, it is not a time to panic. As detailed below, every recession is unique, with varying lengths and severities. Putting recessions in context, we have come through each slowdown in the past, and the trajectory of the U.S. economy over time has been positive.
Stages of the business cycle1
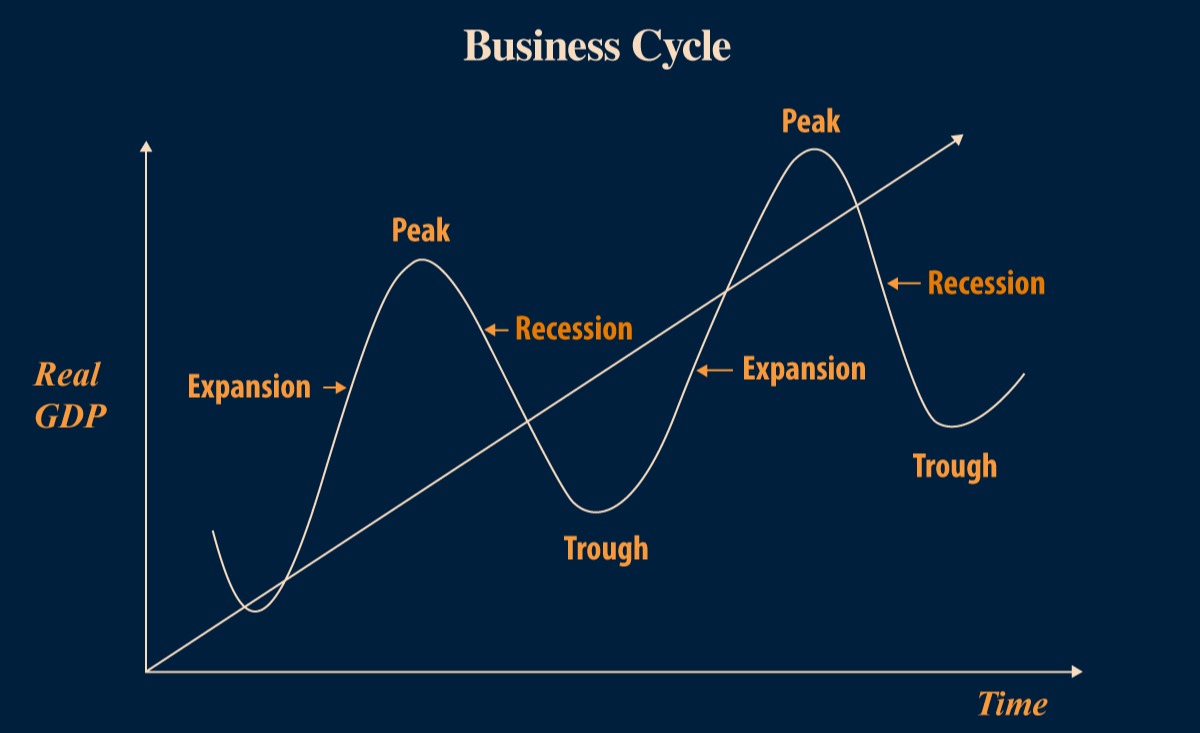
The economy’s movement through alternating periods of growth and contraction is known as the business cycle. The business cycle has four phases: expansion, peak, contraction, and trough.
During an expansion, the economy experiences relatively rapid gross domestic product (GDP) growth, interest rates tend to be low, and employment, corporate profits, and output tend to be high. But the increase in the money supply due to low-interest rates may cause inflation to pick up.
The economy peaks when growth hits its maximum rate. Peak growth typically creates imbalances in the economy when businesses and consumers start reevaluating spending for fear that the good times won’t last.
The contraction phase occurs when growth slows. A significant decline in economic activity that lasts for several months or even years may be classified as a recession. The National Bureau of Economic Research (NBER) defines the starting and ending dates of U.S. recessions. NBER defines a recession as “a significant decline in economic activity spread across the economy, lasting more than a few months, normally visible in real GDP, real income, employment, industrial production, and wholesale-retail sales.” Recessions are called in hindsight. NBER no longer simply declares a recession after two consecutive quarters of declining GDP.
The trough occurs when the economy hits a low point, with supply and demand at their worst for the cycle. However, like the peak, the trough allows opportunities for individuals and businesses to adjust their finances in anticipation of a recovery.

What causes a recession?1
There are several reasons the economy can stop expanding and tip into recession. Here are some factors that have caused recessions in the past:
- A sudden economic shock: An economic shock is a surprise problem that creates widespread financial issues. The coronavirus outbreak is a more recent example.
- Excessive debt: When individuals or businesses take on too much debt, it can result in growing defaults and bankruptcies. In part, the Great Recession of 2007 to 2009 was caused by excessive debt.
- Asset bubbles: Investors can become too optimistic during a strong economy, which can cause bubbles. Bubbles are characterized by a rapid escalation of the market value of assets. When bubbles burst, recessions can follow.
- High inflation: Excessive inflation for protracted periods of time can be dangerous. The high inflation of the 1970s prompted the Fed to steadily raise interest rates, causing a recession.
- Deflation: Deflation is when prices decline over time. This can cause companies to cut wages, further depressing prices and slowing growth. Japan’s deflation in the 1990s resulted in a recession.
Recessions are not uncommon
As unpleasant as they can be – especially for those who lose their jobs or businesses – recessions are not an uncommon part of the business cycle. In fact, the U.S. economy has managed through 13 recessions since World War II. These downturns have ranged from long and deep to short and shallow. On average, America’s post-war recessions have lasted 10 months, while expansions have lasted for 57 months.2
Here are all the U.S. recessions since 1945, their cause, and length.

How the markets respond to recessions
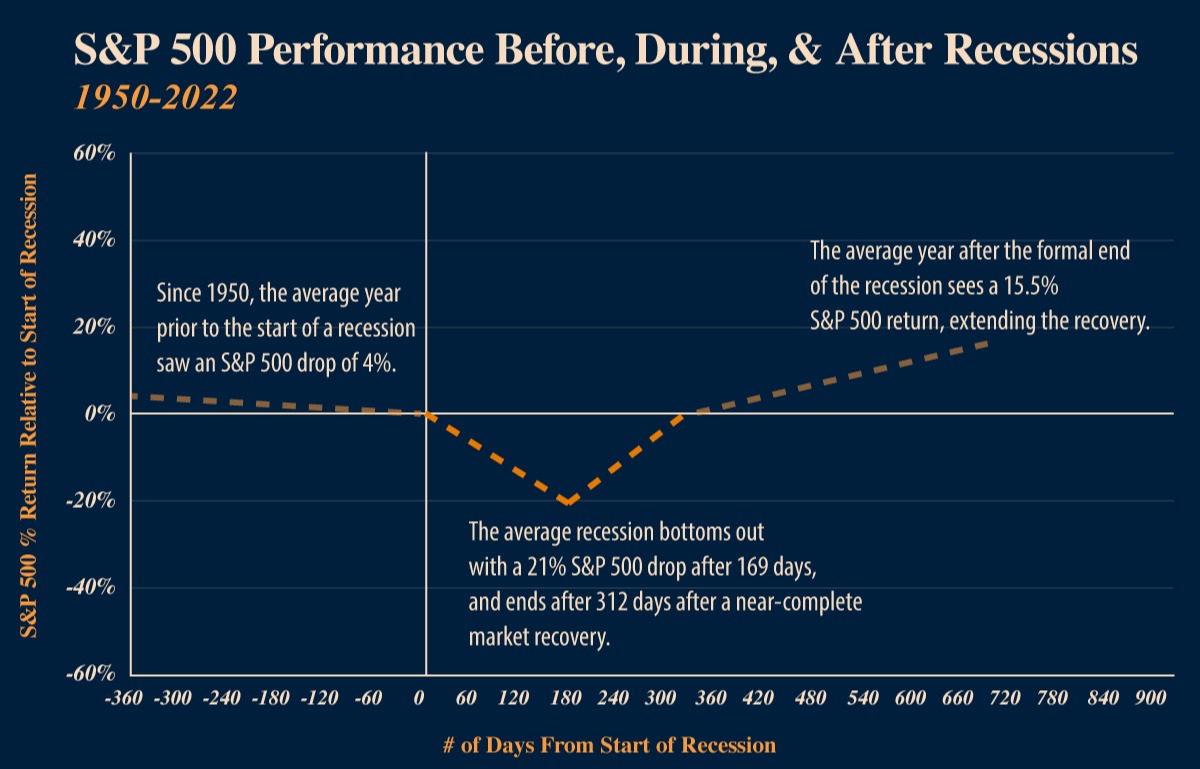
The accompanying illustration shows how stock prices have reacted before, during, and after each of the 13 recessions. Since 1950, stock prices have anticipated recessions, dropped during them, and started to rise before their ending. Keep in mind that past performance is no guarantee of future returns.3,4,5
More specifically, the illustration shows that stocks dropped an average of 4% in the year before each recession. During the recession itself, the stocks fell about 20% before entering a recovery phase and trending higher.3
Pinpointing the start of economic recovery by looking at stock prices is hard because the stock market is considered a leading economic indicator, which anticipates what conditions will be six-12 months in the future. That means that stock prices today can reflect a recovery before a recession is officially over and the economy is in an expansion phase again.

What’s next for 2023?
Is a recession likely in 2023? That’s uncertain. But short-term conditions should not cause you to alter a well-thought-out financial strategy. Instead of pouring over economic indicators that can all be flashing different signals, it’s much more important to know that your portfolio reflects your goals, time horizon, and risk tolerance.6
As financial professionals, we know trying to time a recession is impossible. We hope that the Fed can orchestrate a “soft landing,” but if they can’t, remember it’s best to focus on your future and not be distracted by short-term fluctuations.
1 Forbes.com, July 12, 2022
2 History.com, 2023
3 CurrentMarketValue.com, November 4, 2022
4 Investing involves risks, and investment decisions should be based on your own goals, time horizon and tolerance for risk. The return and principal value of investments will fluctuate as market conditions change. When sold, investments may be worth more or less than their original cost.
5 Stocks are represented by the Standard & Poor’s 500 Composite Index, an unmanaged index that is considered representative of the overall U.S. stock market. Individuals cannot invest directly in an index. The S&P 500 was expanded in 1957 to include 500 stocks. Prior, the composite index comprised 233 companies.
6 Forbes.com, January 20, 2023


